Republican presidential nominee Donald Trump, in a major speech on August 8 outlining his economic plan for the country, made what has been treated as almost an off-hand remark (at 24m48s):
“We have the lowest labor force participation rates in four decades. 58% of the African-American youth are either outside of the labor force or not employed. One in five American households do not have a single member in the labor force, not a single member of a household. These are the real unemployment numbers. The 5% figure is one of the biggest hoaxes in American modern politics.”
Trump is conflating unemployment (which is defined as wanting but not having work) with labor market participation (which recognizes that many people do not want work because they might be disabled, elderly, toddlers and so on), but he has been making the same claim for a long time. A year ago, Josh Zumbrun in The Wall Street Journal appropriately ridiculed him under the headline “Donald Trump Is Right: About 42% of Americans Are Unemployed (If You Include My 88-Year-Old Grandma).”
Trump has thoroughly demonstrated a shocking failure to understand basic economic theory and often cites statistics on the spectrum between misleading and fantasy, but his assertion that the official unemployment rate is a big hoax touches a nerve with a lot of Americans who feel subjective unease about the economy that is at odds with the most recent (July 2016) official unemployment rate, compiled by the federal government Bureau of Labor Statistics (BLS), of only 5.1% – implying that 94.9% of those wanting work have it. Like a stopped clock that is correct twice a day, Trump is not completely wrong.
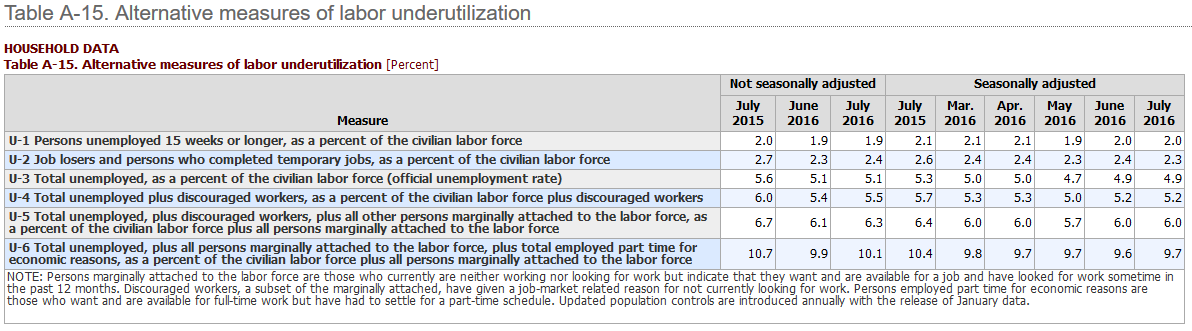
In fact, the BLS computes six different unemployment rates labeled “U-1,” “U-2,” and so on through “U-6.” (We’ll ignore U-1 and U-2.) What gets reported on in the news is U-3, defined as those who want work and have looked for it unsuccessfully within the past four weeks. Not often reported is U-4, adding to U-3 “discouraged workers” who want work and have looked for it unsuccessfully within the past 12 months, but have stopped looking because they believe they would not find any. U-5 adds those “marginally attached to the labor force” who want work and have looked for it unsuccessfully within the past 12 months, but have stopped looking for whatever reason. U-6 adds those who are underemployed, working part-time despite wanting full-time.
While U-3 was 5.1% nationally last month (July 2016), U-6 was 10.1% – and it is the latter much larger number that likely more closely coincides with how workers feel about their own safety or lack thereof in the job market.
There is an urban myth that the official unemployment rate counts only people collecting unemployment insurance, but that has never been true; it may originate from confusion about U-3 only counting those who look for work within the last four weeks. Also contrary to popular misconception, no one ages out of the U-3 count unless they actively stop looking for work; if you have not looked for work in the last 12 months, you don’t even count in U-6 and are considered no longer in the labor force at all.
Subjective perception of economics is also greatly influenced by where you fit in terms of age, sex, race and location.
As of June 2016, U-3 in RI is 5.5%, 0.4 points above the national rate, while U-3 in MA is 4.2%, 0.9 points below. Every RI county except Providence is doing better (Newport 4.3%, Bristol 4.4%, Kent 4.6%, Washington 4.6%) while Providence is doing worse (5.6%), and Providence County swamps the rest because its labor force of about 325,000 is much larger than the other counties who share a combined labor force of about 233,000. The BLS does not supply U-6 with county granularity, but it is reasonable to assume that the almost exactly 2-to-1 ratio of U-6 to U-3 is consistent, suggesting U-6 for Providence County is probably approximately 11.2%. Urban Providence is effectively an island of high unemployment surrounded by more economically healthy areas.
That’s still not the whole story. For people age 16 to 19, U-3 nationally is 16.3% and labor force participation is 43.2%. Trump is sort of correct in saying most black youth are not in the labor force although 34.4% are, but that is equally true of white youth of whom only 46.0% are. Trump avoided an inconvenient fact: U-3 for black youth is 28.3% and for white youth is 14.7% – meaning that black youth are twice as likely as white youth to be unable to find work when seeking it. Youth labor force participation rates are irrelevant without context because most people this age are still in high school.
Different industries appear very differently in U-3, especially cyclical sectors such as mining, quarrying, and oil and gas extraction (9.3%), leisure and hospitality (6.0%), and information (5.7%) compared to financial activities (2.4%) and education and health services (3.7%). What this means in practice is that a restaurant server has a 20% harder time finding a job than the average worker, while a bank teller has a 50% easier time. Workers in wholesale and retail trade (5.2%) have about average difficulty.
The main point here is that unemployment statistics are meaningful only in the aggregate across large numbers of people, and any given individual is quite likely to experience the job market either much more favorably or unfavorably than the abstract and homogenized average. Politicians aggressively exploit this misunderstanding, and that sort of economic deception is a key part of Trump’s appeal to disaffected workers who have seen entire industries uprooted around them.
Some of the factors influencing subjective perception are beyond your control, such as age, race and sex; other are within only a limited degree of control, such as location; but a few are entirely within your control given enough good information, such as the kind of job you are seeking. How valuable is it to know that, all other things being equal, your chances of being hired to work in a bank as a teller or call center operator are more than twice as good as your chances of being hired to work in a restaurant or coffee shop?