In RI, during the COVID-19 emergency Gov. Gina Raimondo has limited informal social gatherings to no more than 15 people and in-person school classrooms to stable groups of no more than 30 students. Where do these numbers come from? The governor has described them as “judgment calls,” but she is not just arbitrarily picking numbers.
At a press conference on Sep 4 (about 45m30s in) I raised this topic with Dr. Nicole Alexander-Scott, director of the RI Department of Health, and she explained that the limits have to be kept small so that, if there is an outbreak, contact tracing and case investigation staff are able to carry out their responsibilities quickly enough to prevent secondary and even tertiary transmission of the virus to others.
But the main issue is that risk of encountering an infected person increases rapidly as group size grows larger, and this is a basic mathematical fact. How does that work?
For the sake of explanation, let’s assume each person coming to your party has a probability of arriving infected of 20%, which is another way of writing 0.2. It should be obvious that, if your party has only a single guest, then the chance of any of the guests being infected is therefore 0.2. What if there are two guests?
It turns out to be easier to compute the probability that none of the guests arrive infected: with a single guest, their probability of being not infected is 1.0-0.2=0.8 (or 80%). With two guests, the probability that both are not infected is 0.8×0.8=0.64 (or 64%). With three guests, the probability all are not infected is 0.8×0.8×0.8=0.512 (or 51.2%). And so on.
This property of multiplying a number by itself repeatedly is called “exponentiation,” often commonly called “raising to a power.” In this case, 0.8 to the 3rd power is 0.512, which we can write using a “caret” symbol as “0.8^3=0.512”.
In general, where the probability of each guest being infected is represented by the letter “p” (which implies their probability of being not infected is 1-p) and the number of guests is represented by the letter “n”, then the probability of all of the guests being not infected, which we can represent by the letter “C” (for “clear”), is (1-p)^n. That’s the sort of thing that’s easy to type into a calculator.
Conversely, if we want to know for a given p (which we can measure experimentally by medically testing people) how many guests n we can allow for a particular risk, we can calculate the n-th root (the opposite of exponentiation) of C. That’s not really sensible when p is as large as 0.2 in our example, but in reality COVID-19 in RI right now is around p=0.02 (2%), implying each guest is 1.00-0.02=0.98 (98%) likely to be not infected.
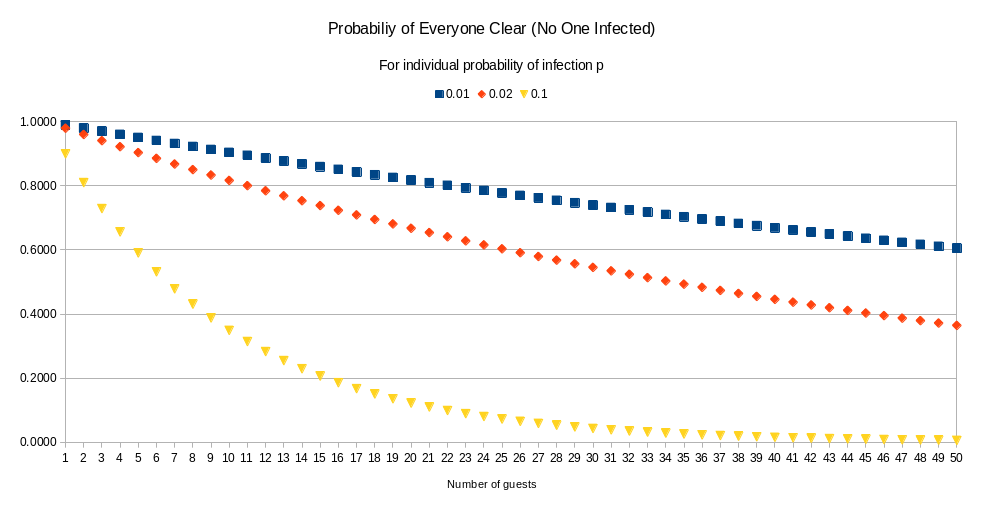
I’ve worked up a handy spreadsheet that figures out the probability that none of the guests are infected, taking into account various values of p and n, and drawn a chart to visualize this. But we can look at some useful reference points.
At p=0.02 (2%), n=10 means our party is 82% likely to have everyone not infected, n=15 reduces that to 74%, n=20 reduces that to 67%, and n=30 reduces that to 55%. This is why the governor is saying that 15 is better than 30: the chance of at least one guest arriving infected rapidly grows to an unacceptable risk, from 1-in-4 to 1-in-2.
At p=0.10 (10%), the numbers fall off a cliff: n=10 means there is only a 35% probability that everyone will arrive not infected, n=15 reduces that to 21%, n=20 reduces that to 12%, and n=30 reduces that to 6%.
Of course, these calculations are a kind of worst-case analysis based upon unchecked community spread. Basic public health measures, especially staying home if you are sick but also observing physical distancing and wearing face coverings, enormously reduce the chance of infecting others. In a structured environment such as a school or workplace, it is possible to enforce this by, for example, screening students and workers as they enter by using simple questionnaires, temperature checks and other methods. If such measures are even 50% effective, that would reduce p from the 0.02 seen in the community to 0.01 inside the school or workplace.
At p=0.01 (1%), n=10 means a 90% chance everyone will arrive not infected, and even n=30 only reduces that to 74%.
The purpose of this analysis is to provide insight into where the governor is getting these numbers and why they differ between different kinds of activities such as informal parties as distinct from school classrooms. Much depends upon how prevalent the virus is in the community, and defining the community is itself a judgment call as prevalence is known to vary between municipalities and even ZIP codes within municipalities. But community prevalence, no matter how chosen and defined, is the baseline from which this kind of mathematical analysis must proceed.